HIGHLIGHTS
- Design a virtual managed pressure drilling operation
- Simulate the operation
- Calculate the pressure profiles, track the mud columns, and visualize the MPD process
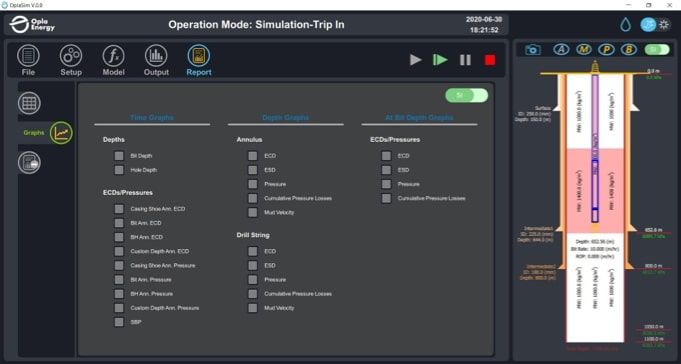
- Generate the simulation study report
- Optimize ongoing operations
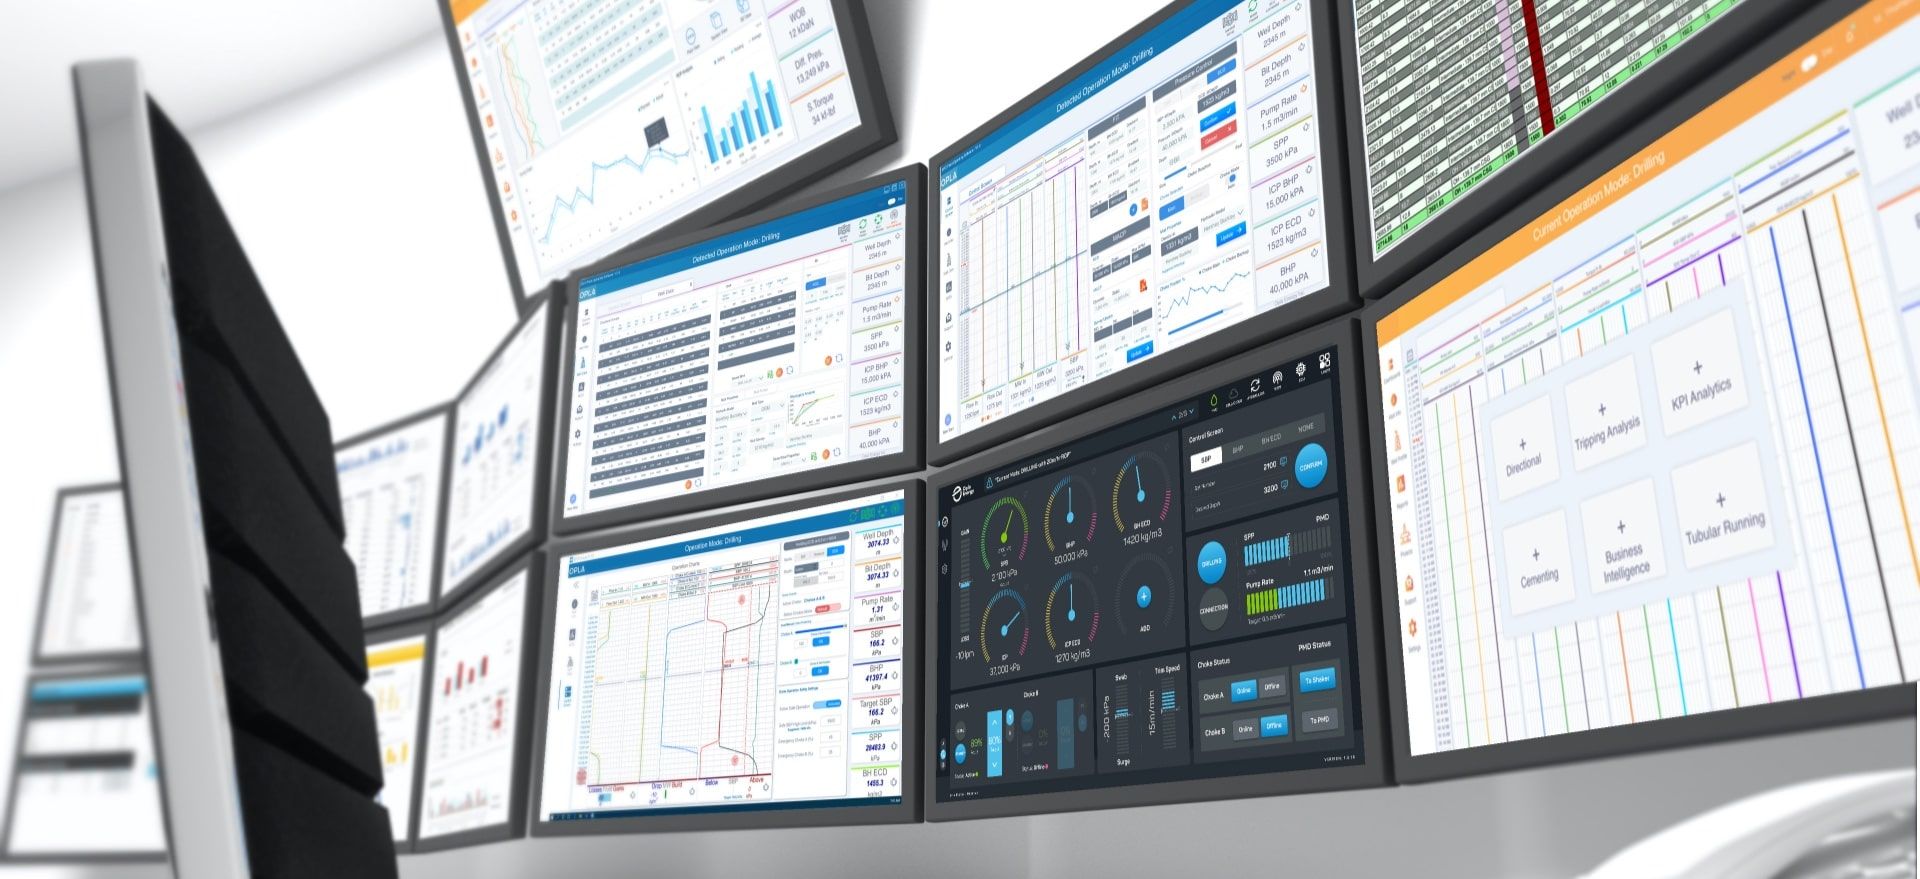
Get a real-time view of what is happening in your wellbore.
Discover Solutions
Enables users to save a constructed MPD project on local or shared servers for future importing.

Allows modeling based on different rheology models.

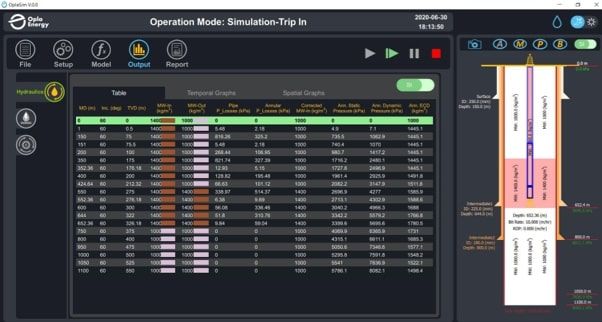
Hydraulics engine capable of tracking the mud columns, calculating the pressure profiles & incorporating the cuttings transport modeling inside the
wellbore.

Multiple density surge & swab-enabled engine to calculate the surge & swab effects inside the wellbore.

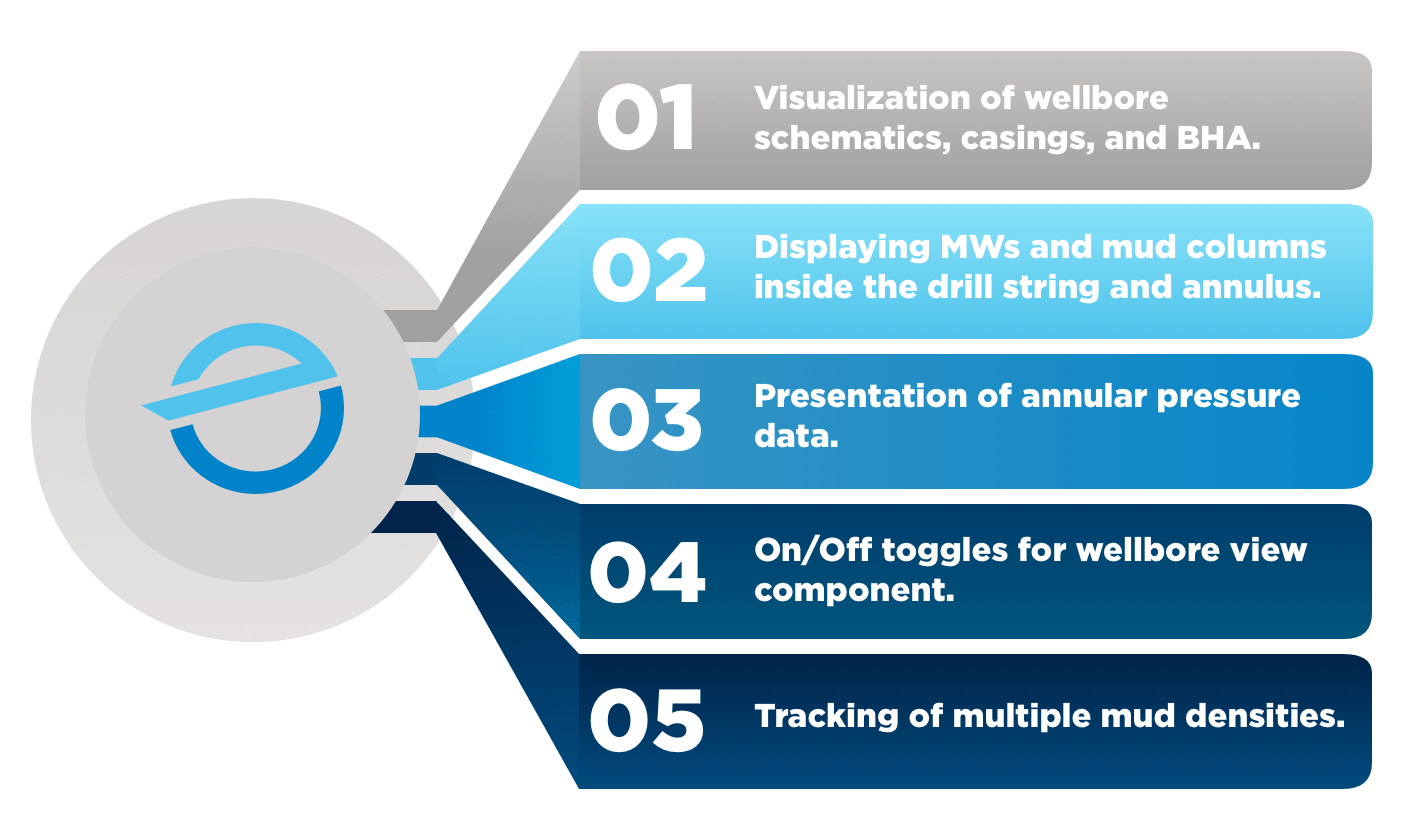
Visualize the wellbore schematics & relevant parameters in the wellbore.

Automatic reporting of the project.

Leverage the artificial intelligence & machine learning tools for predicting pressure profiles & downhole events during pre-planning & real-time MPD operations.

Precise, prompt force & movement calculations.

Enable users to simulate from the web viewer.
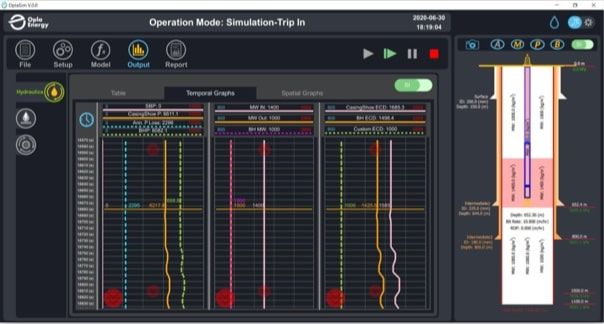
View time (temporal) pressure/ECD/MW graphs as the simulation occurs.
View results in different sections of the wellbore to see changes over time.
Enables the user to model the rheology behavior of the mud in the wellbore using Power-Law, Bingham-Plastic, or Herschel–Bulkley (Yield Power-Law). Mud tracking allows multiple density simulations.
View depth-based pressure/ECD/MW graphs as the simulation occurs.
OplaSim offers customizable reports and graphs with the click of a button.
Providing you with personalized real-time engineering solutions to ever-changing and complex drilling problems.